

|
|
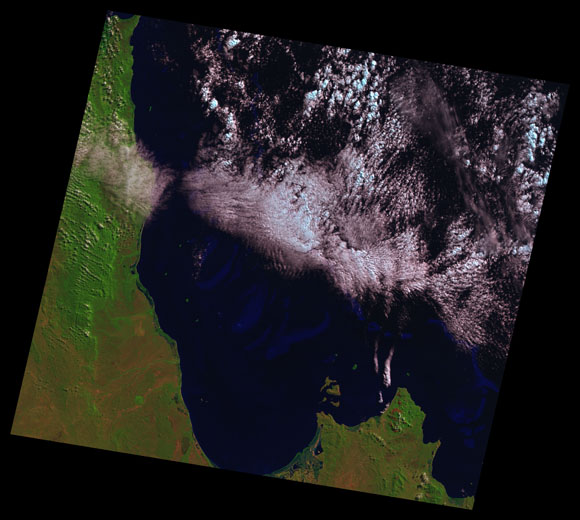
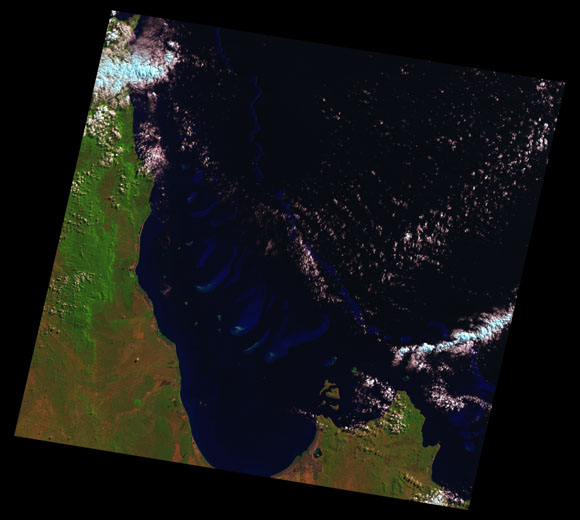
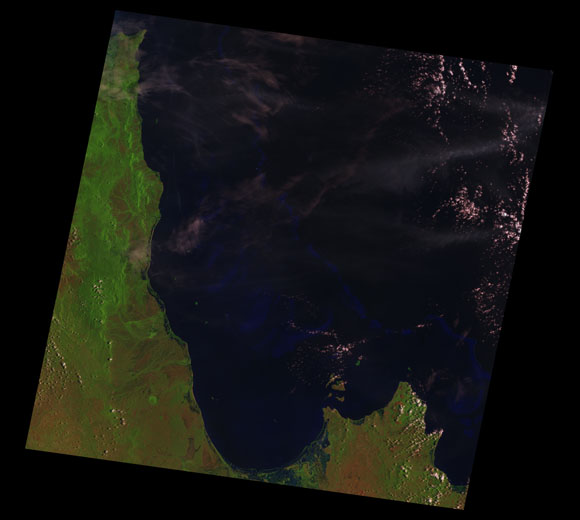
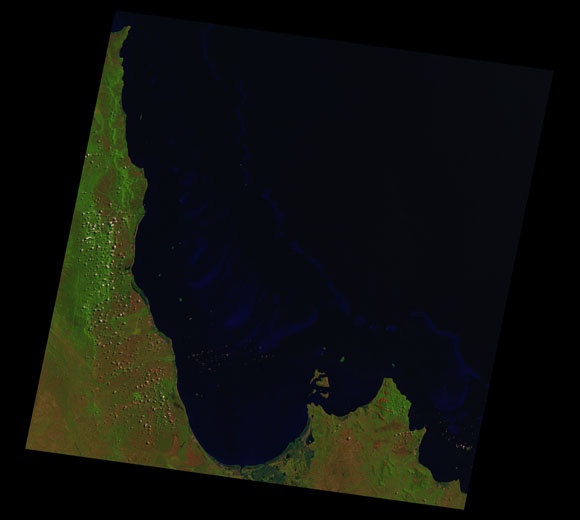
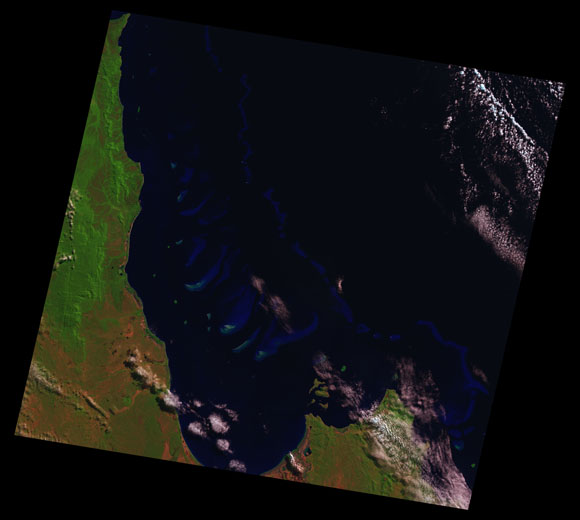
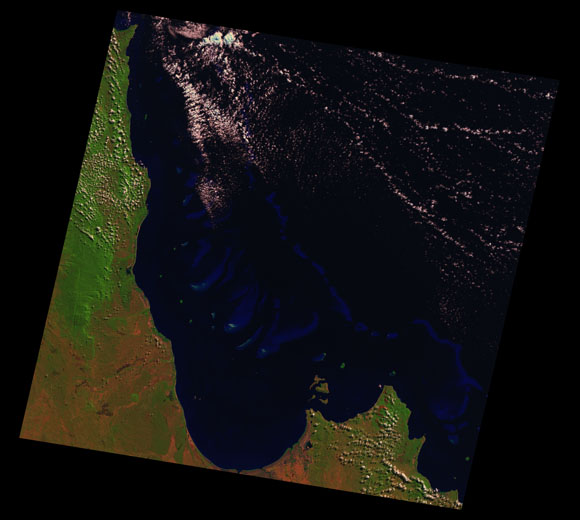
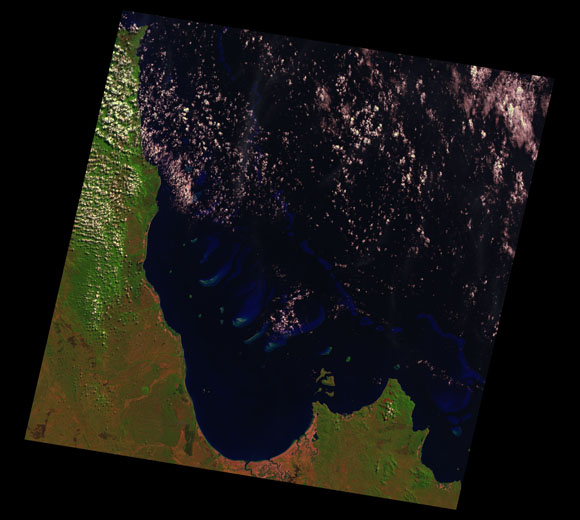
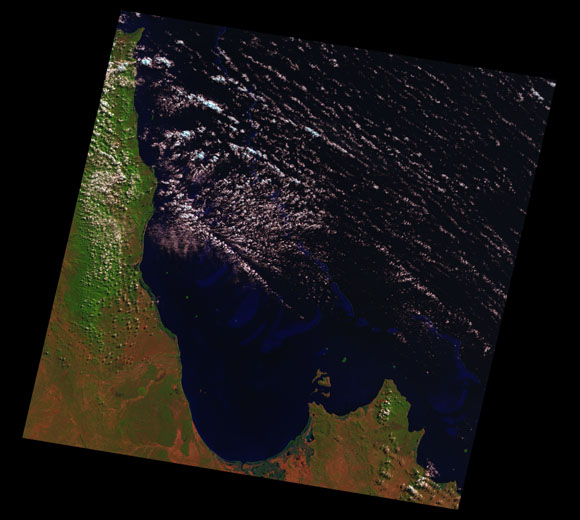
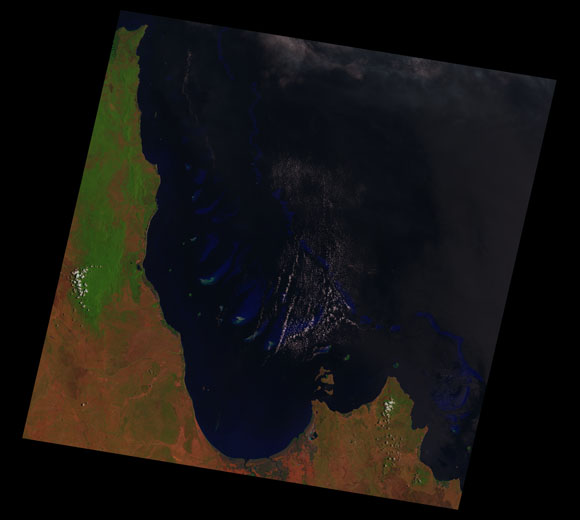
Princess Charlotte Landsat SceneWRS path/row Sub-bioregions
08.8% Battle Camp Sandstones
04.6% Coastal Plains
37.1% Laura Lowlands
15.2% Starke Coastal Lowlands
Wetland mapping
Estimated Yearly mean zonal rainfall across the Princess Charlotte Landsat Scene Year 1997 1998 1999 2000 2001 2002 2003 2004 2005 2006 0 500.0 1,000 1,500 2,000 2,500 Long term yearly mean 1,213mm Images are colour-mapped to enhance the contrast of water bodies (Shortwave→Red, Near-infrared→Green, Green→Blue) Copyright Commonwealth of Australia - Geoscience Australia This page should be cited as: Department of Environment, Science and Innovation, Queensland (2013) Princess Charlotte Landsat Scene, WetlandInfo website, accessed 13 April 2025. Available at: https://wetlandinfo.des.qld.gov.au/wetlands/resources/tools/hydro-climate/scene/prin/ |

 — Department of the Environment, Tourism, Science and Innovation
") : 97/69-70
: 97/69-70