

|
|
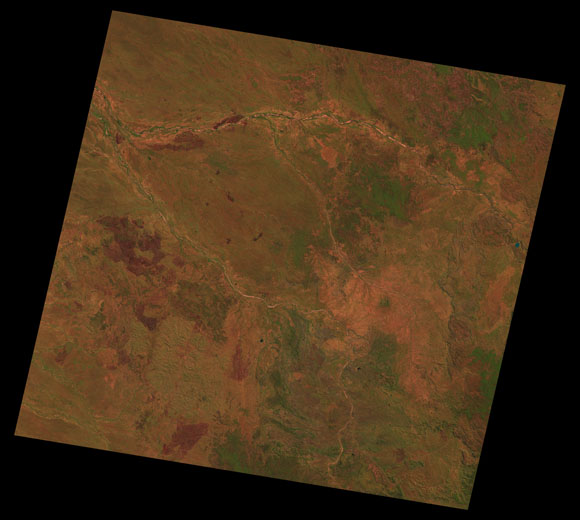
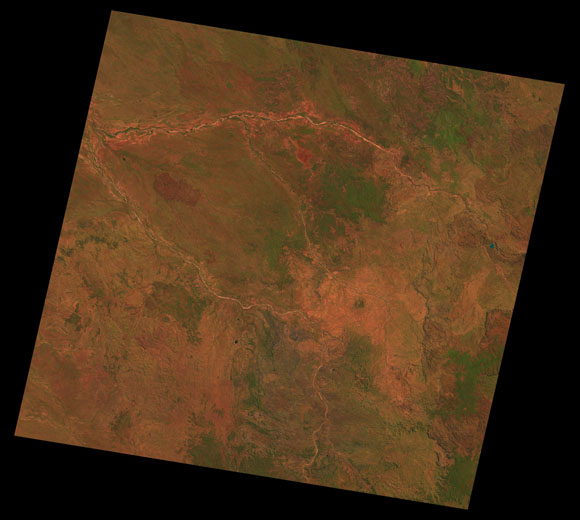
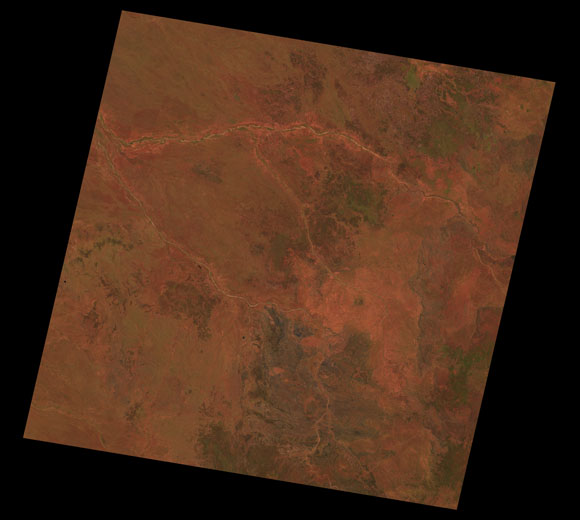
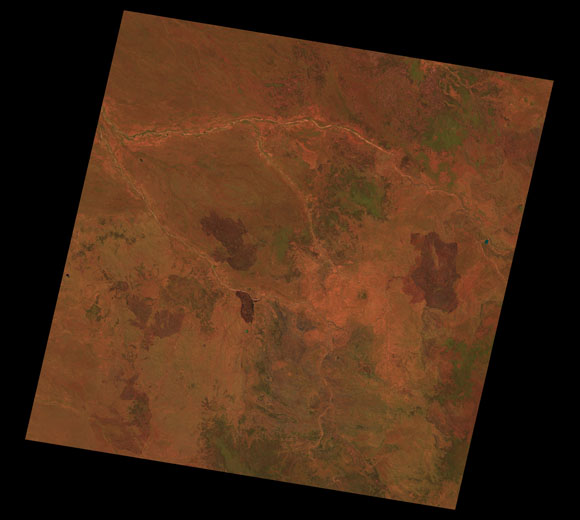
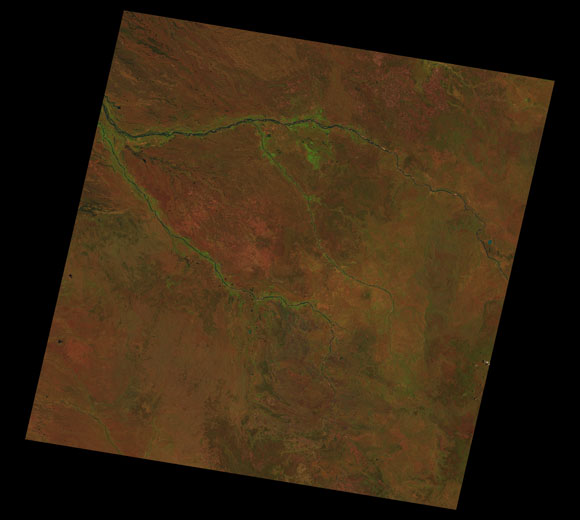
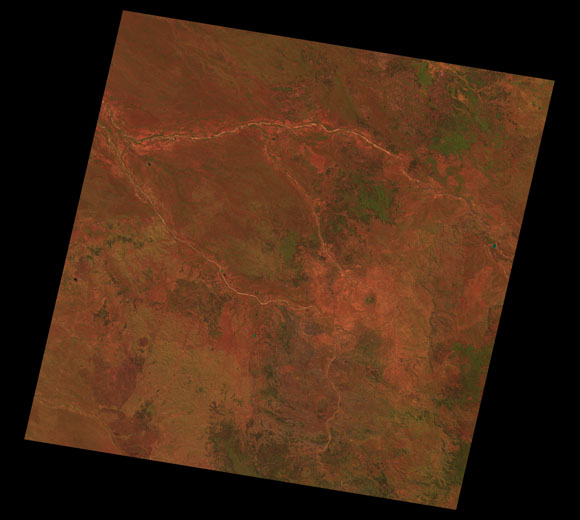
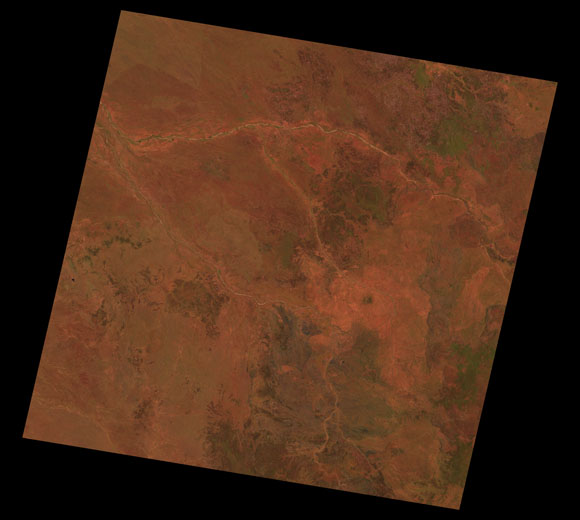
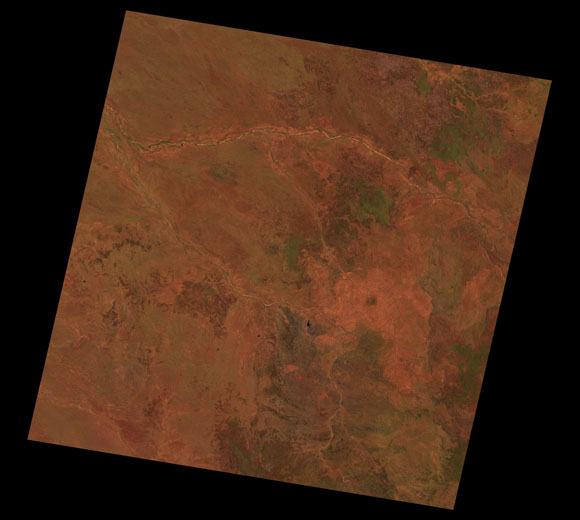
Georgetown Landsat SceneWRS path/row Sub-bioregions
03.1% Claraville Plains
37.8% Georgetown - Croydon
04.8% Gilberton Plateau
11.4% Kidston
12.8% Mitchell - Gilbert Fans
Wetland mapping
Images are colour-mapped to enhance the contrast of water bodies (Shortwave→Red, Near-infrared→Green, Green→Blue) Copyright Commonwealth of Australia - Geoscience Australia This page should be cited as: Department of Environment, Science and Innovation, Queensland (2013) Georgetown Landsat Scene, WetlandInfo website, accessed 15 April 2025. Available at: https://wetlandinfo.des.qld.gov.au/wetlands/resources/tools/hydro-climate/scene/geor/ |

 — Department of the Environment, Tourism, Science and Innovation
") : 97/72-73
: 97/72-73