

|
|
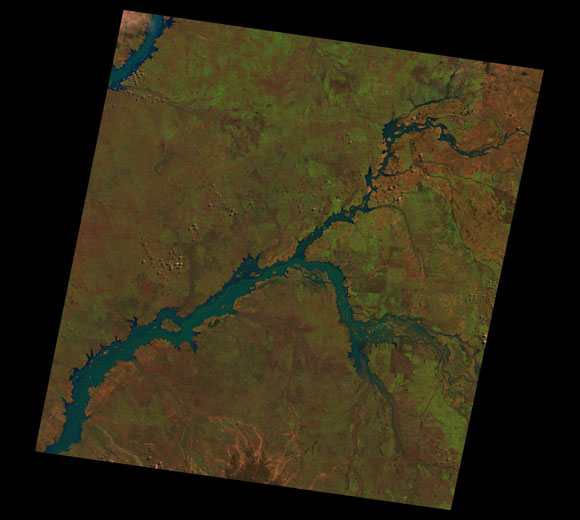
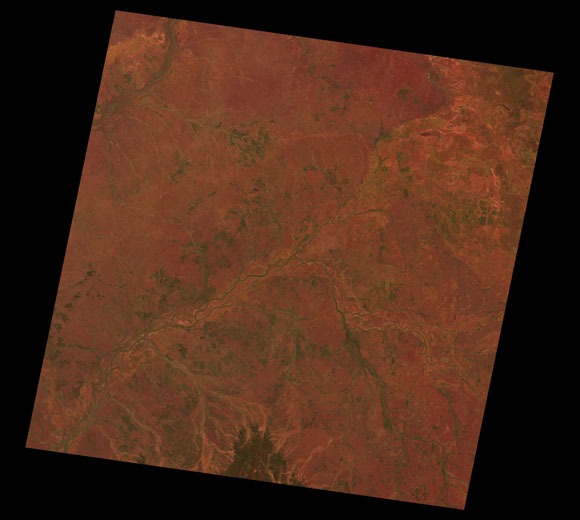
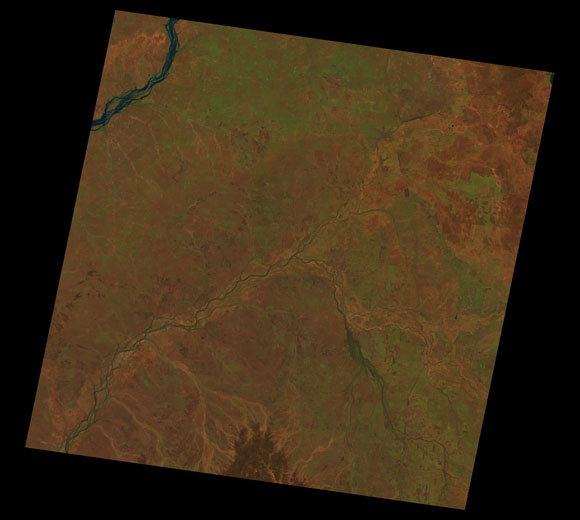
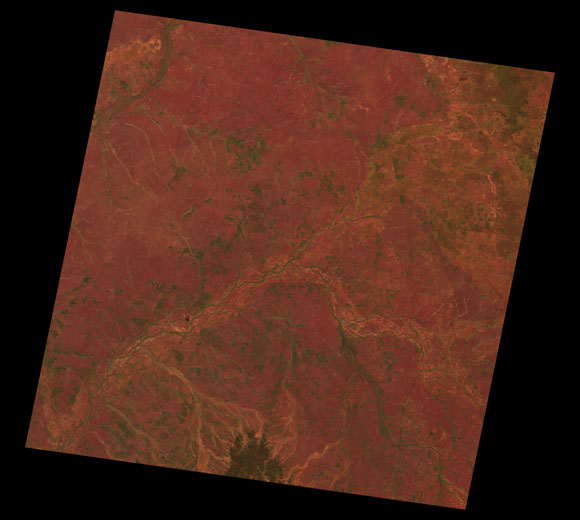
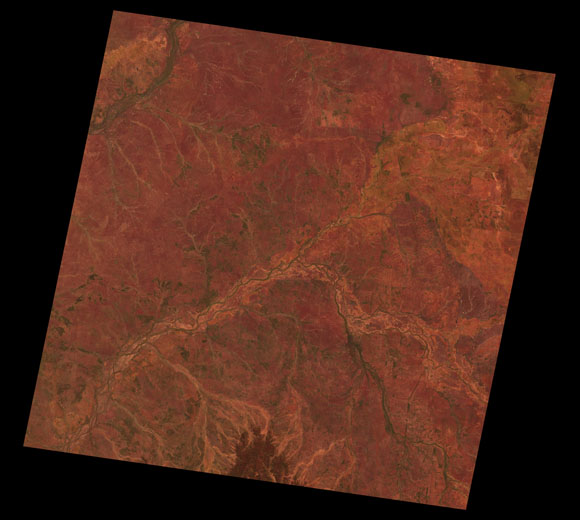
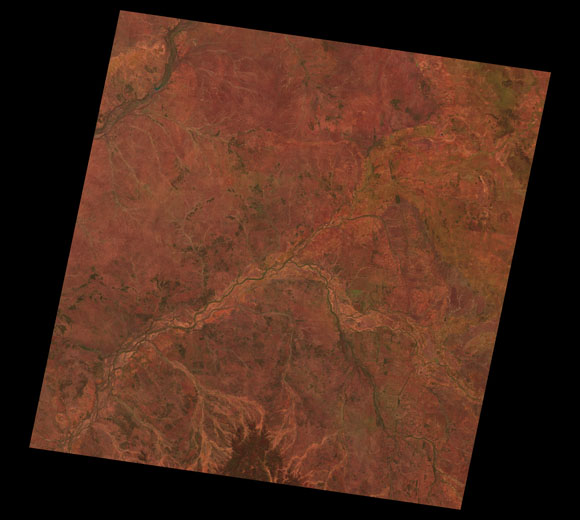
Isisford Landsat SceneWRS path/row Sub-bioregions
00.3% Alice Tableland
32.4% Central Downs
09.1% Jericho
00.6% Northern Uplands
57.6% Southern Wooded Downs
Estimated Yearly mean zonal rainfall across the Isisford Landsat Scene Year 1997 1998 1999 2000 2001 2002 2003 2004 2005 2006 0 200.0 400.0 600.0 800.0 Long term yearly mean 510.5mm Images are colour-mapped to enhance the contrast of water bodies (Shortwave→Red, Near-infrared→Green, Green→Blue) Copyright Commonwealth of Australia - Geoscience Australia This page should be cited as: Department of Environment, Science and Innovation, Queensland (2013) Isisford Landsat Scene, WetlandInfo website, accessed 15 April 2025. Available at: https://wetlandinfo.des.qld.gov.au/wetlands/resources/tools/hydro-climate/scene/isis/ |

 — Department of the Environment, Tourism, Science and Innovation
") : 95/76-77
: 95/76-77