

|
|
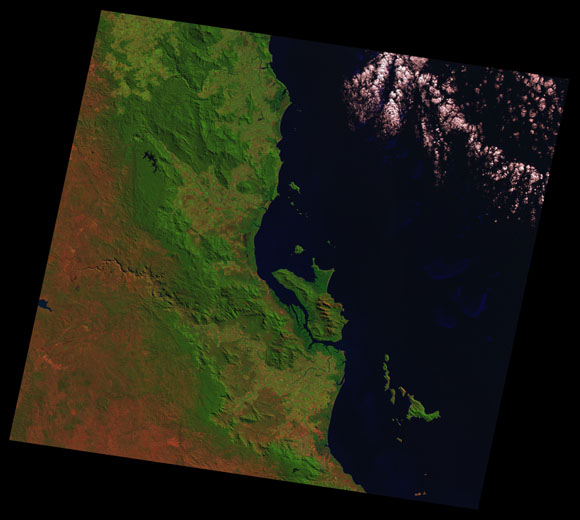
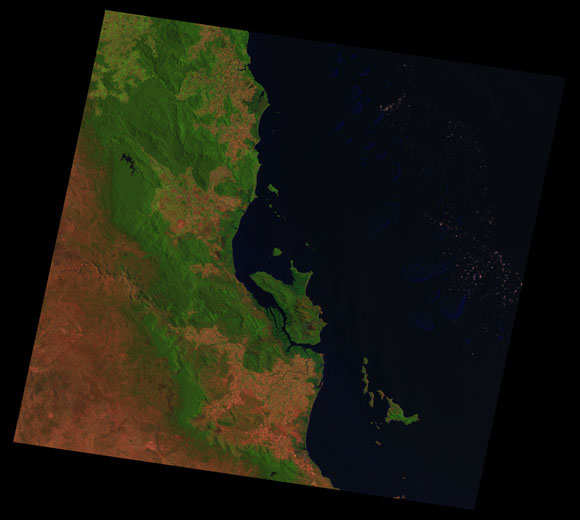
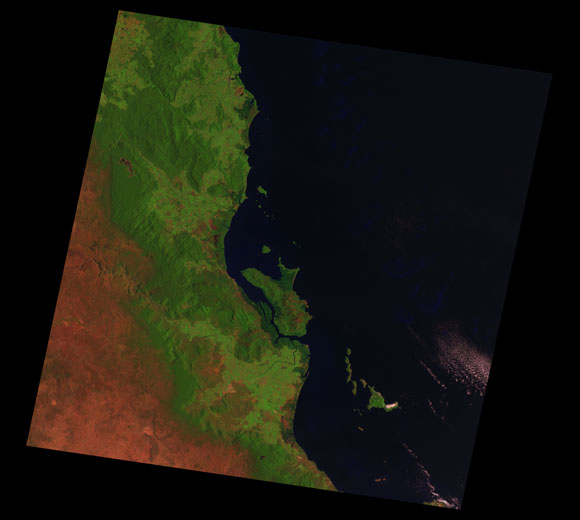
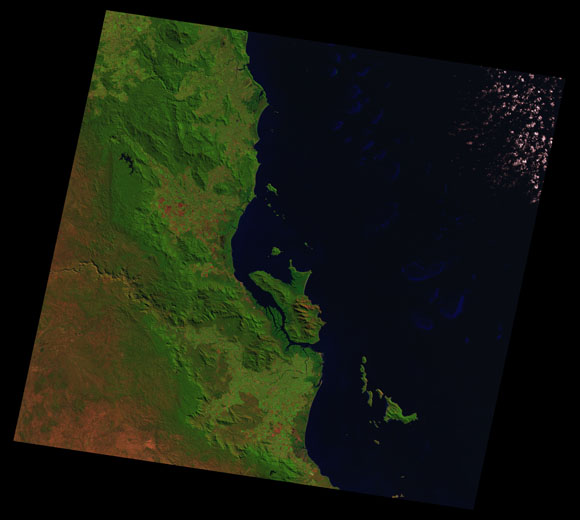
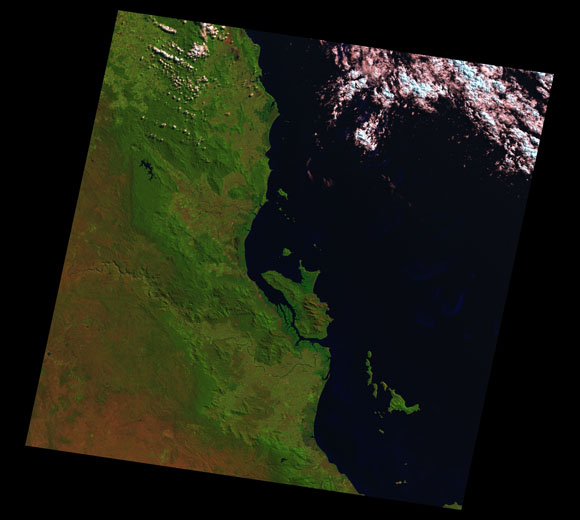
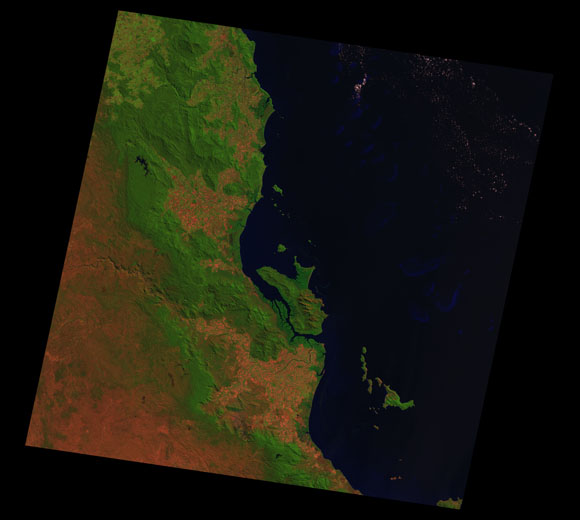
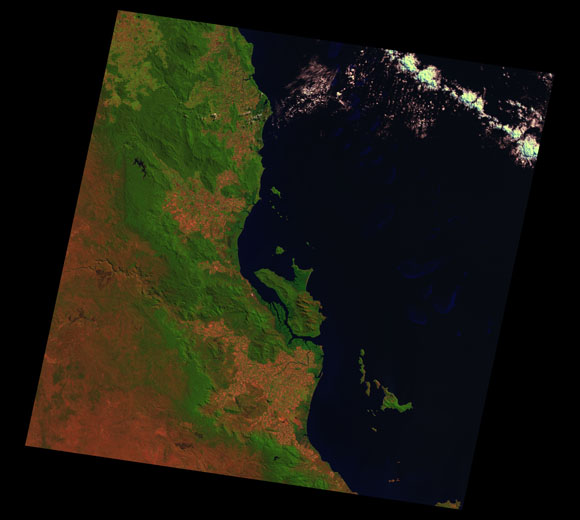
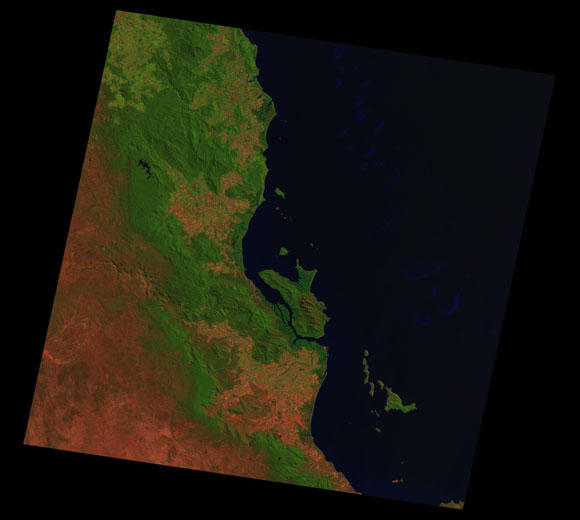
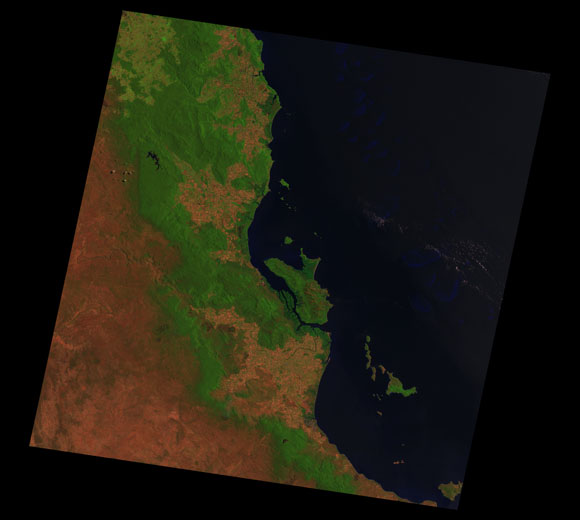
Ingham Landsat SceneWRS path/row Sub-bioregions
02.6% Atherton
07.4% Bellenden Ker - Lamb
07.7% Broken River
18.8% Herbert
10.4% Herberton - Wairuna
11.1% Innisfail
17.4% Kirrama - Hinchinbrook
10.8% Paluma - Seaview
13.7% Tully
Wetland mapping
Estimated Yearly mean zonal rainfall across the Ingham Landsat Scene Year 1997 1998 1999 2000 2001 2002 2003 2004 2005 2006 0 500.0 1,000 1,500 2,000 2,500 3,000 3,500 Long term yearly mean 1,806mm Images are colour-mapped to enhance the contrast of water bodies (Shortwave→Red, Near-infrared→Green, Green→Blue) Copyright Commonwealth of Australia - Geoscience Australia This page should be cited as: Department of Environment, Science and Innovation, Queensland (2013) Ingham Landsat Scene, WetlandInfo website, accessed 15 April 2025. Available at: https://wetlandinfo.des.qld.gov.au/wetlands/resources/tools/hydro-climate/scene/ingh/ |

 — Department of the Environment, Tourism, Science and Innovation
") : 95/72-73
: 95/72-73